Advanced Analytics
Overview
Welcome to the Advanced Analytics section, a powerful tool within VP's solutions that provides detailed insights into the performance of your multimedia content. There are four tabs available: Videos, Podcasts, Live Videos, and Audios. This guide will walk you through the key features and data available in each section.
General Overview
Upon selecting the tabs, you will be presented with a comprehensive summary of usage history of the project. The data is displayed in "Month to Date," offering a current snapshot of your content's performance.
Videos Tab
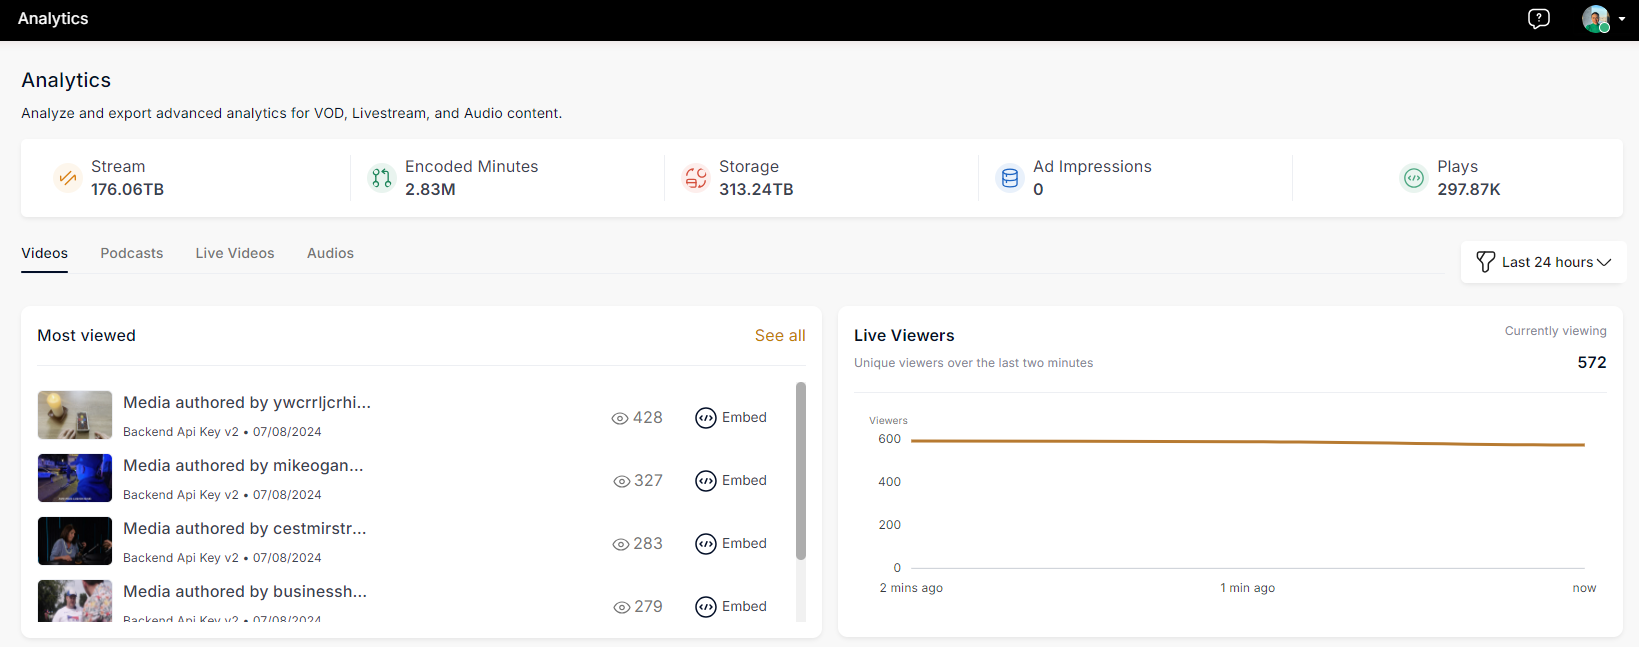
1. Most Viewed
- Highlights the most viewed videos within the selected project.
2. Live Viewers
- Displays the number of live viewers in the last 2 minutes , offering real-time engagement data. This section remains static, irrespective of time filters
 3. Engagement Metrics
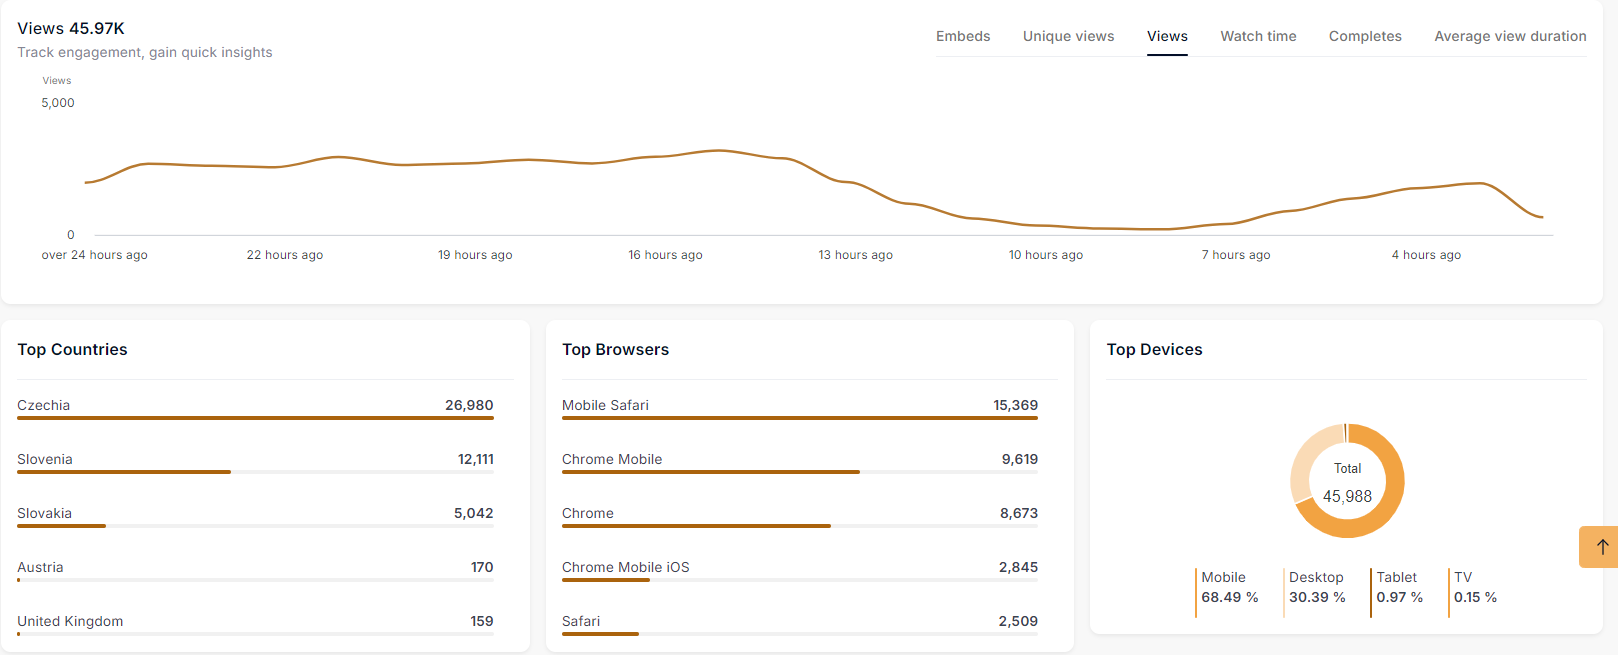
- Provides insights into embeds, unique views, views, watch time, completed views, and average view duration.
Explore all available metrics by visiting our "Video Analytics Metrics".
4. Geographical, Browsing, and Device Insights
- Showcases top countries, browsers, and devices based on aggregated data for all videos in the selected time frame.
Podcasts Tab
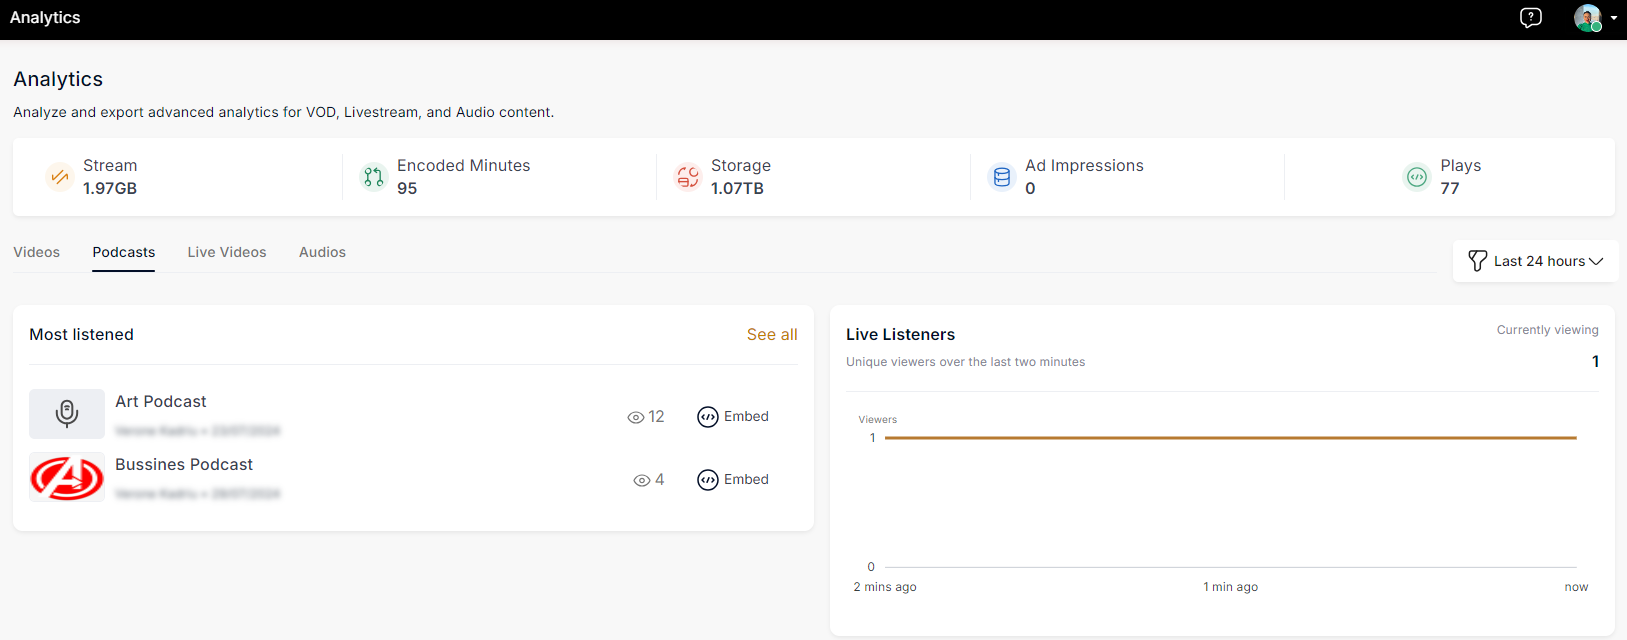
1. Most Played Episodes
- Highlights the most played podcast within the selected project.
2. Live Listeners
- Displays the number of live listeners in the last 2 minutes. This section remains static, irrespective of time filters.
3. Engagement Metrics
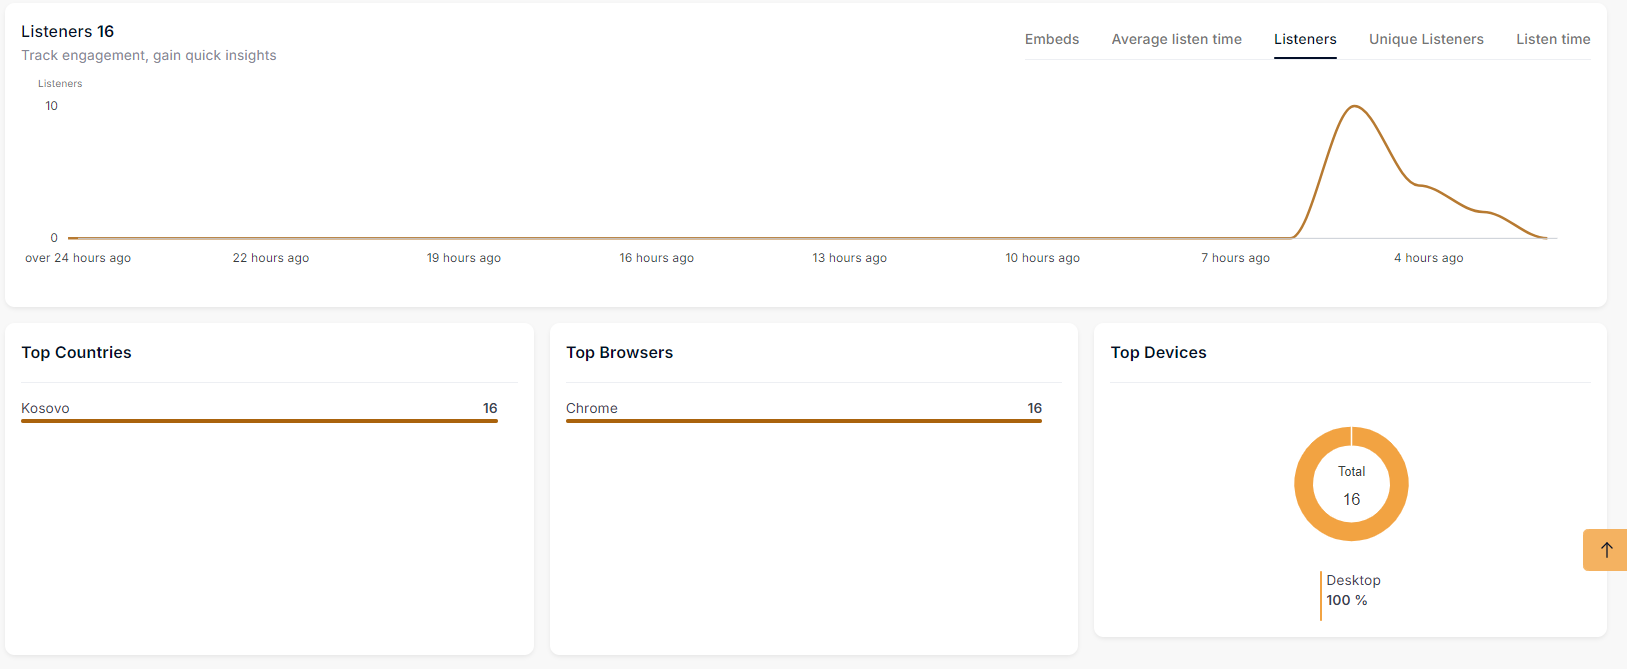
- Provides insights into embeds, listeners, unique listeners, listen time, and average listen time duration.
Explore all available metrics by visiting our "Audio Analytics Metrics".
4. Geographical, Platform, and Device Insights
- Showcases top countries, podcast platforms, and devices based on aggregated data for all podcast ep in the selected time frame.
Live Videos Tab
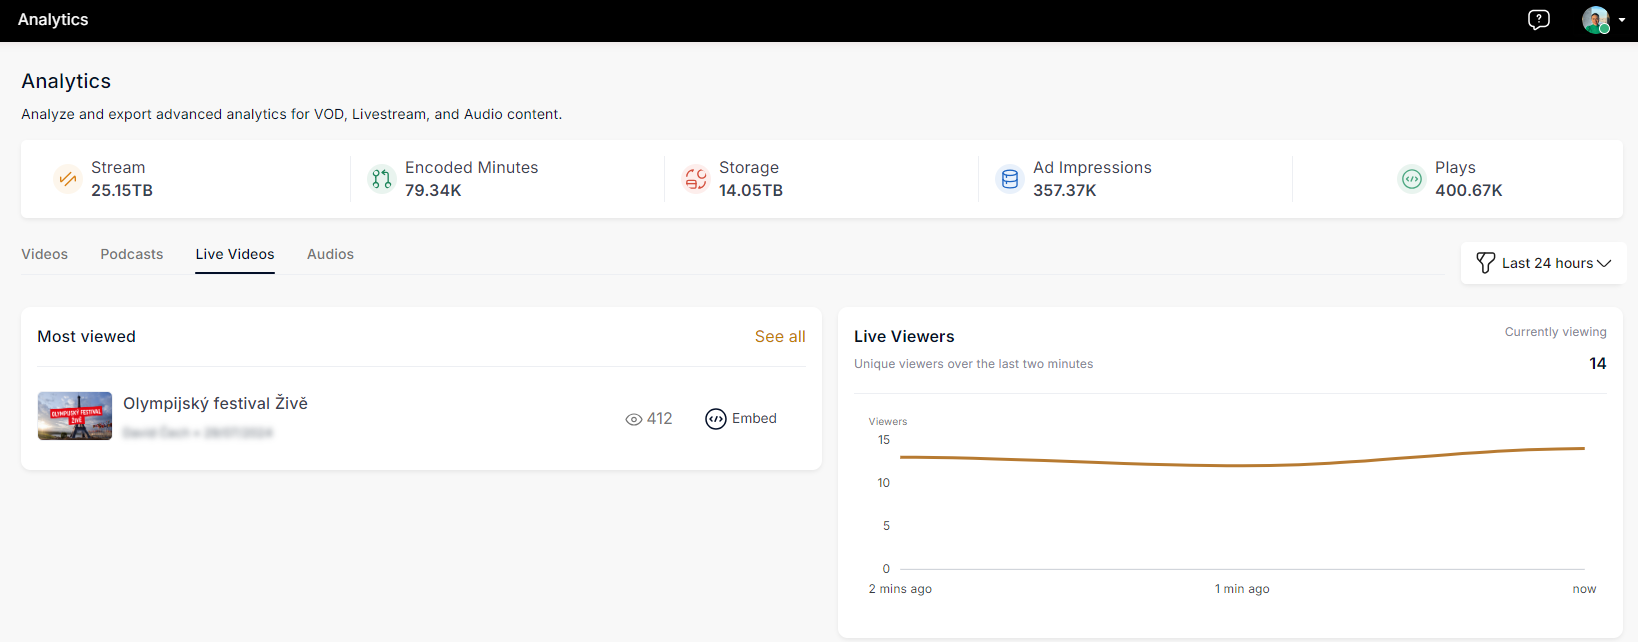
1. Most Viewed Live Streams
- Highlights the most viewed live video streams within the selected project.
2. Current Live Viewers
- Displays the number of current live viewers. Similar to Live Videos, this section remains static and unaffected by time filters.
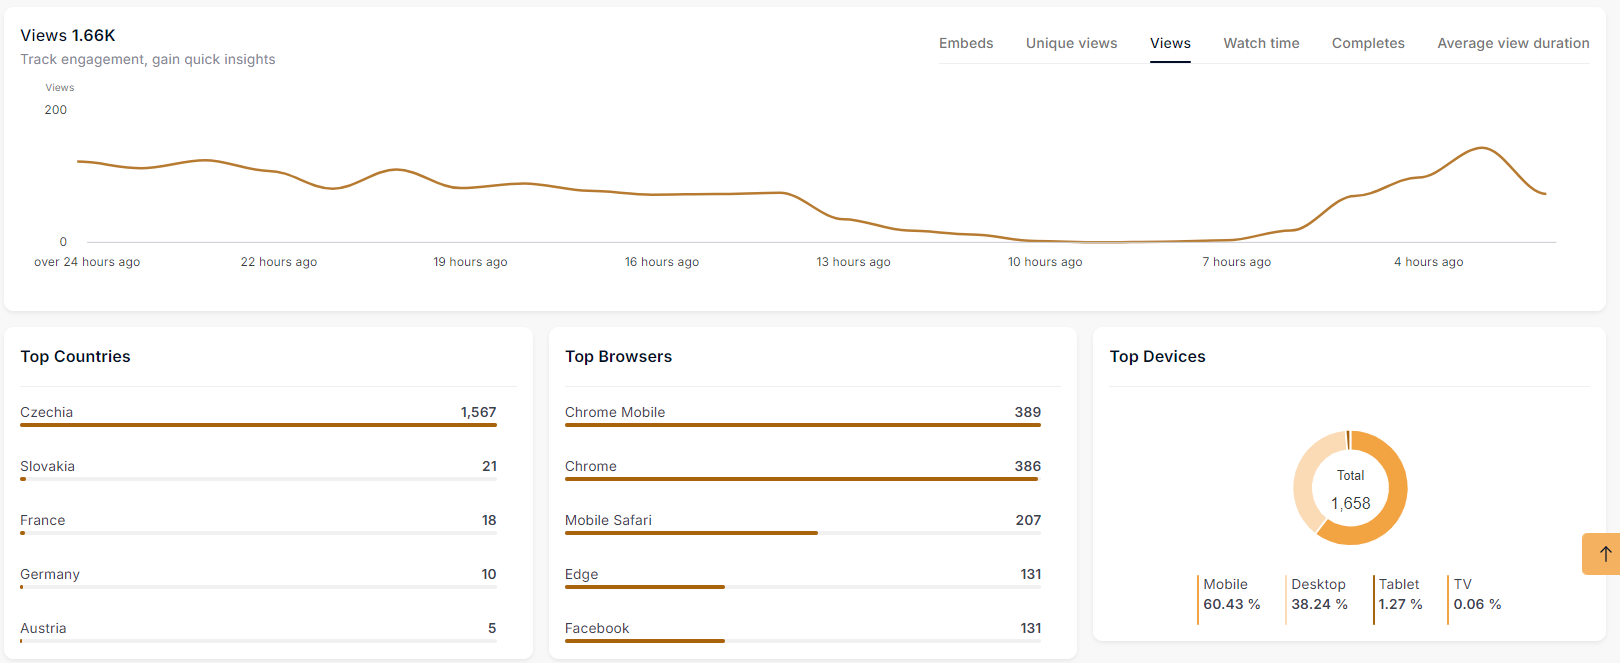
3. Engagement Metrics
- Provides insights into embeds, unique live viewers, total live views, live watch time, completed live views, and average live view duration.
4. Geographical, Platform, and Device Insight:
- Showcases top countries, streaming platforms, and devices based on aggregated data for all live video streams in the selected time frame.
Audios Tab
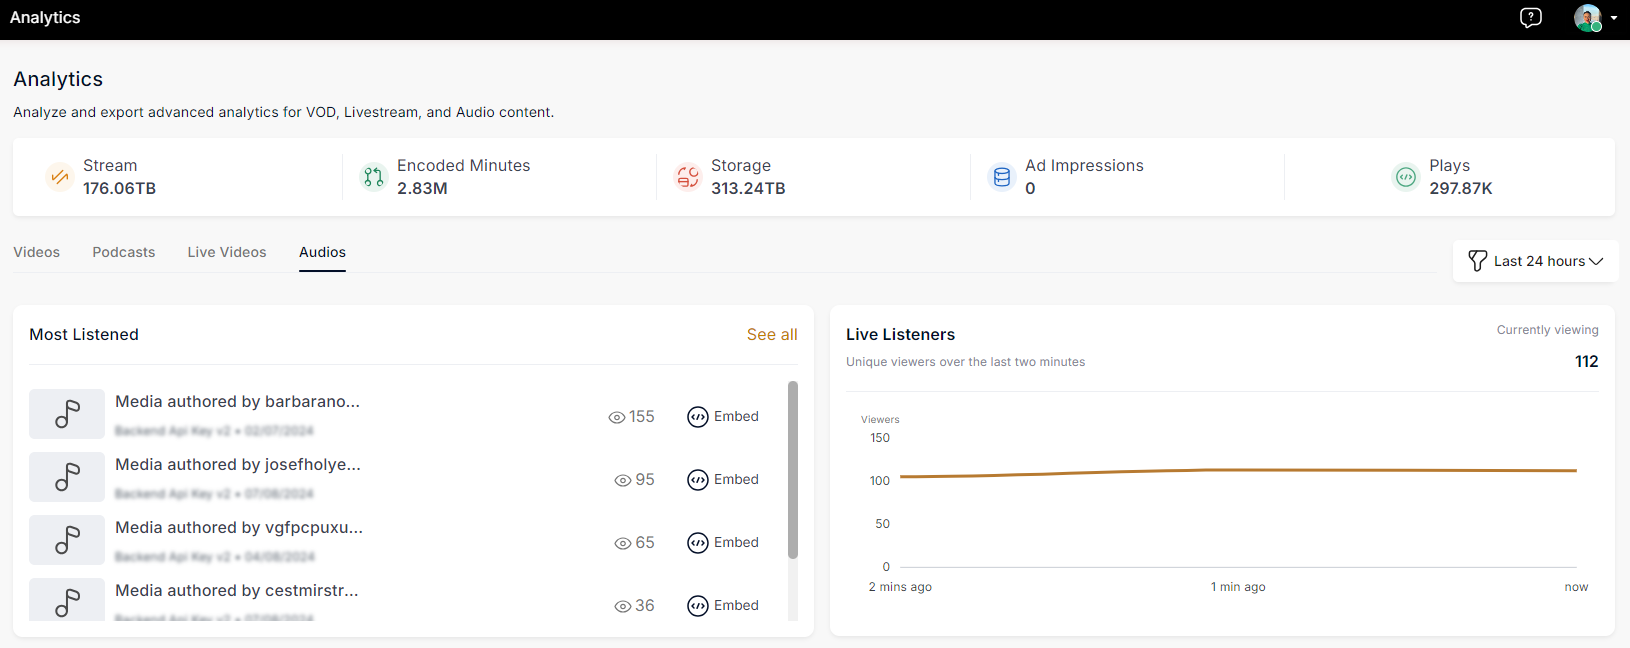
1. Most Listened
- Highlights the most listened-to audio content within the selected project.
2. Live Listeners
Displays the number of live listeners in the last 2 minutes. Similar to other teabs, this section remains static, unaffected by time filters.
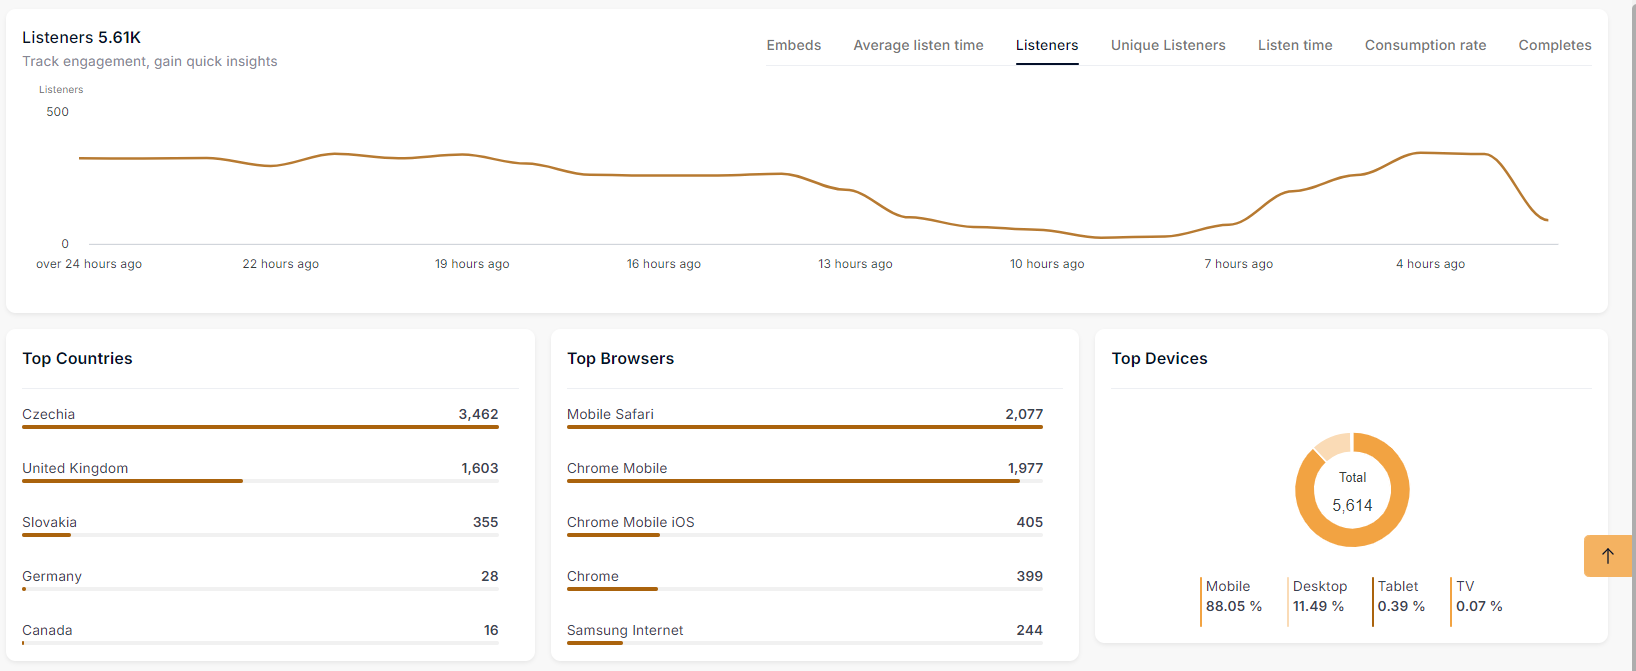
3. Engagement Metrics
- Provides insights into embeds, unique listens, listens, total listening time, completed listens, and average listen duration.
4. Geographical, Platform, and Device Insights
Showcases top countries, top browsers, and top devices based on aggregated data for all audio content in the selected time frame.
Filtering Data
You can apply filters to view data for specific time frames or projects. Simply select the desired time range or project from the filter options available.
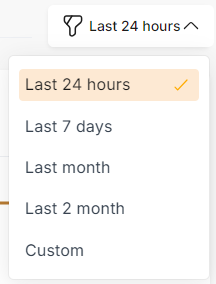
These filters allow you to select a time range for viewing data:
- Last 24 hours: Displays data from the most recent 24-hour period.
- Last 7 days: Shows data from the past week.
- Last month: Presents data from the previous month.
- Last 2 months: Displays data from the past two months.
- Custom: Allows you to specify a custom time range.
To use a Custom filter, select the specific start and end date for the data you want to retrieve.
Video Analytics Metrics
- Embeds: Tracks the number of times videos have been embedded on external websites or platforms.
- Unique views: The number of distinct individuals who have viewed videos, with each viewer counted only once, regardless of how many times they watch.
- Views: The total count of all views videos have received.
- Watch time: The cumulative amount of time that viewers have spent watching videos.
- Completes: The number of times viewers have watched videos from start to finish.
- Average view duration: The average amount of time viewers spend watching videos.
The Live Video tab also uses the same metrics as the Video tab
Audio Analytics Metrics
- Embeds: Tracks the number of times audios have been embedded on other websites or platforms.
- Average listen time: The average duration that listeners engage with audio content.
- Listeners: The total count of all individuals who have listened to audio content.
- Unique Listeners: The number of distinct individuals who have listened to audios, with each listener counted only once regardless of how many times they listen.
- Listen time: The total amount of time that has been spent listening to audio content.
The Podcast tab also uses the same metrics as the Audio tab
Summary
The Advanced Analytics section provides a detailed and insightful overview of your multimedia content's performance. Use these analytics to make informed decisions, optimize content, and enhance engagement across your projects.