Analytics
Analytics dashboard for video content provides insights into the performance and impact of the content.
Access to information on the video content of the projects is done by clicking on the Dashboard section on the left navigation bar.
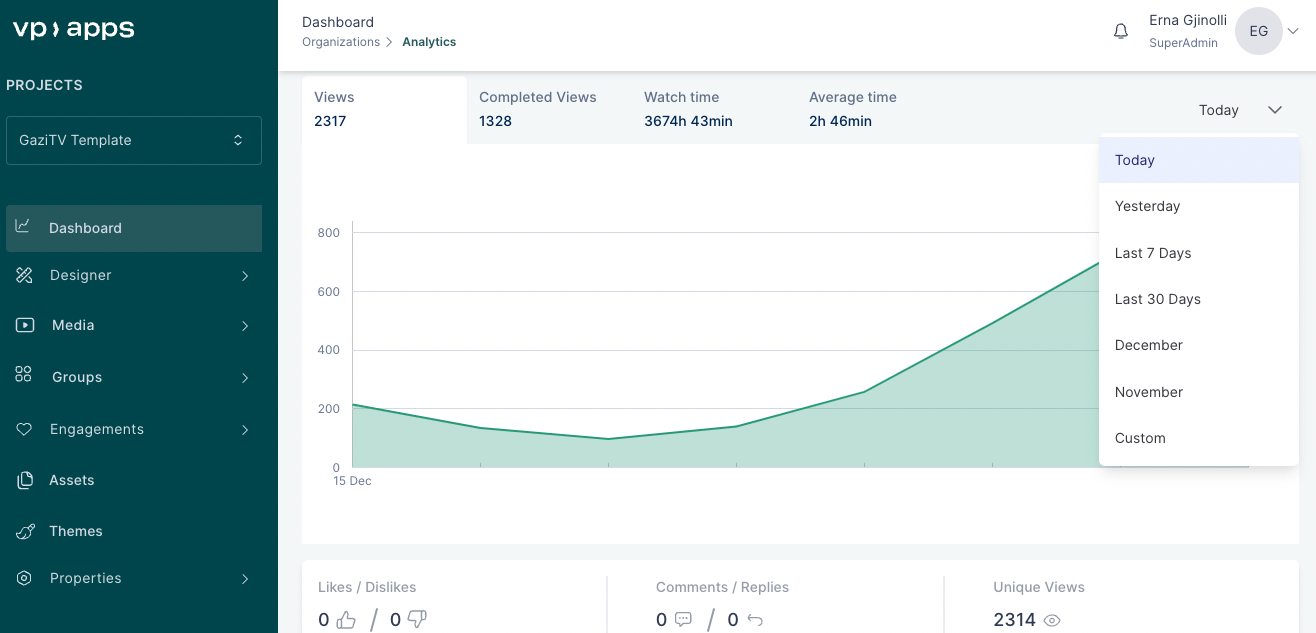
The information in the dashboard includes these metrics: views, completed views, watch time and average watch time in minutes. On the top-right side of the graph, you can view the graph based on filters.
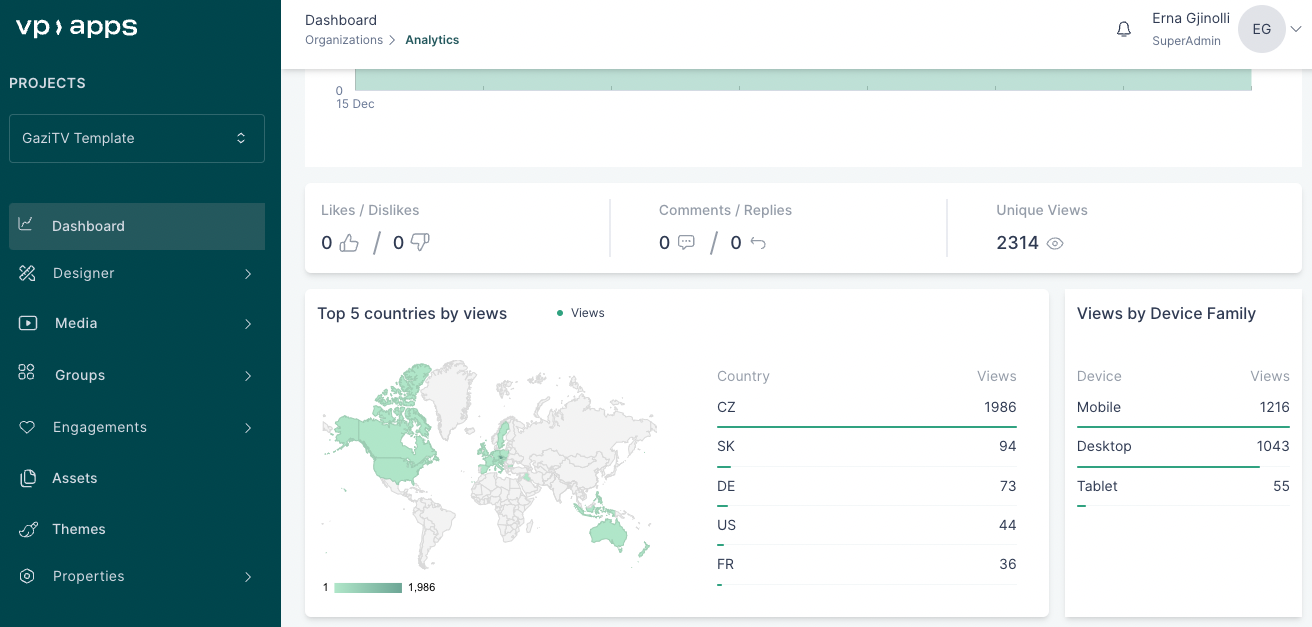
Likes and dislikes in media, comments and replies, as well as unique views are some other metrics that are displayed on the dashboard.
The countries list shows some of the countries, but hovering over the map shows the views from all the countries. On the bottom right side, the statistics based on the device are displayed.