Looker Studio Integration Guide (via Google Sheets) with VP Analytics API
1. Overview
This guide explains how to visualize VP Player analytics data (e.g., plays, unique viewers, devices, browsers, completion rates, etc.) in Looker Studio, using Google Sheets as a data bridge.
Data Flow:
- VP Analytics API → Google Apps Script → Google Sheets → Looker Studio Dashboards
2. Data Flow Summary
- VP Analytics API – Provides analytics data through secure endpoints using custom queries (dimensions, metrics, filters).
- Apps Script – Executes the API call and writes the returned data into a Google Sheet.
- Google Sheets – Acts as the data source for Looker Studio..
- Looker Studio – Visualizes the data in customizable dashboards and reports.
3. Requirements
- Get Your API Key
- To access the VP Player Analytics API, an API Key is required.
- You can find your key in the VP Player Admin Interface under: User Guide > Security > ApiKeys.
4. Create the Data Import Script(Google Sheets)
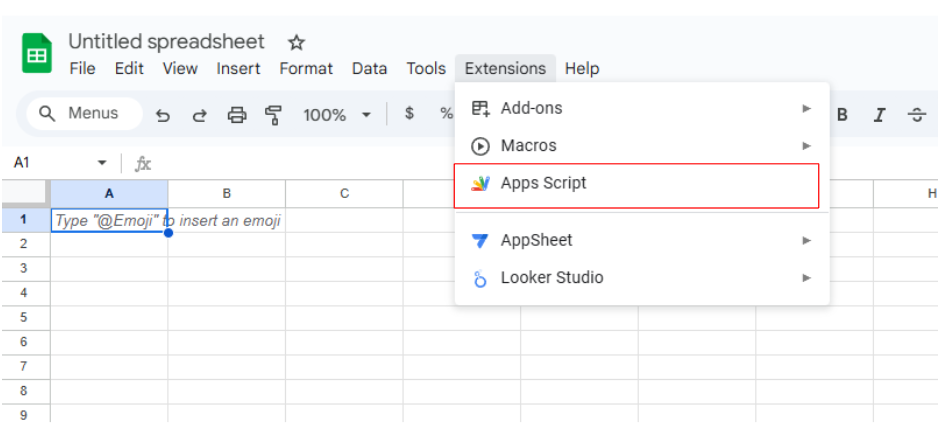
Step 4.1: Open Apps Script
Create/open a Google Sheet (empty is fine).
Extensions → Apps Script.
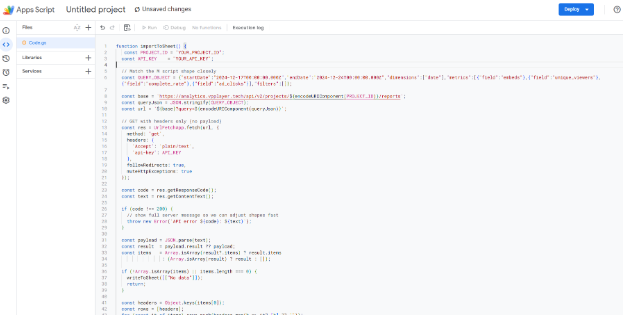
Step 4.2: Paste the Script
You can use the JSON query that is automatically generated when you create a New Custom Report in the VP Player Admin Panel. This can be found under Analytics → Custom Reports in the left navigation menu.
If you’re not using a predefined Custom Report, you can manually build your own query by specifying dimensions, metrics, and filters.
To learn how to create a New Custom Report from the Admin panel, visit our documentation: "Create Custom Report"
To fetch available dimensions, metrics, and filters directly through the API, visit our documentation: Custom Report Fields API
Replace any code with the snippet below.
Edit PROJECT_ID, API_KEY, and QUERY_OBJECT to your needs.
function importToSheet() {
  const PROJECT_ID = "YOUR_PROJECT_ID";
  const API_KEY    = "YOUR_API_KEY";

//query
  const QUERY_OBJECT = {
    startDate:  "2025-09-01T00:00:00Z",
    endDate:    "2025-10-01T00:00:00Z",
    dimensions: ["devices", "browser"],    // e.g., ["date"], ["devices","browser"]
    metrics: [
      { field: "plays" },
      { field: "unique_viewers" },
      { field: "complete_rate" }
    ],
    filters: {},                           // important: object {}, not []
    takeAll: true
  };

  const base = `https://analytics.vpplayer.tech/api/v2/projects/${encodeURIComponent(PROJECT_ID)}/reports`;
  const url  = base + `?query=${encodeURIComponent(JSON.stringify(QUERY_OBJECT))}`;

  const res = UrlFetchApp.fetch(url, {
    method: 'get',
    headers: {
      'Accept': 'application/json',
      'api-key': API_KEY,
      // Helps some firewalls/WAFs
      'User-Agent': 'Mozilla/5.0 (Windows NT 10.0; Win64; x64) PowerQuery/2.0',
      'X-Requested-With': 'XMLHttpRequest'
    },
    followRedirects: true,
    muteHttpExceptions: true
  });

  const code = res.getResponseCode();
  const text = res.getContentText();
  if (code !== 200) throw new Error(`API error ${code}: ${text}`);

  const payload = JSON.parse(text);
  const result  = payload.result ?? payload;
  const items   = Array.isArray(result?.items) ? result.items :
                  (Array.isArray(result) ? result : []);

  if (!items.length) return writeToSheet([["No data"]]);

  const headers = Object.keys(items[0]); // infer columns from first row
  const rows = [headers, ...items.map(r => headers.map(h => r?.[h] ?? ""))];
  writeToSheet(rows);
}

function writeToSheet(rows) {
  const sh = SpreadsheetApp.getActiveSheet();
  sh.clearContents();
  sh.getRange(1, 1, rows.length, rows[0].length).setValues(rows);
}
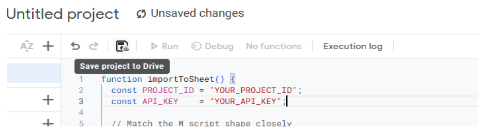
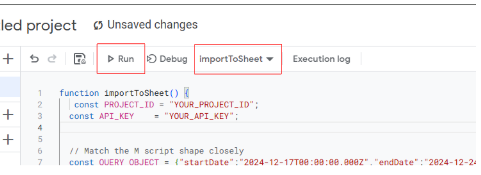
Step 4.3: Save & Run
Click Save.
Ensure the function dropdown shows importToSheet.
Click Run → approve permissions on the first run.
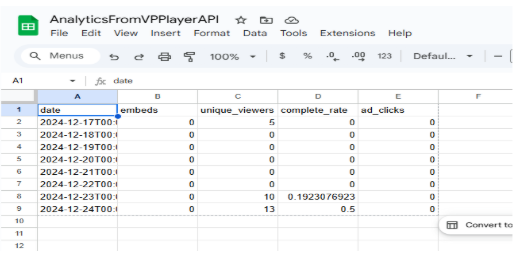
Return to your Sheet and verify that the first row contains the headers and data has been imported.
5. Connect Google Sheets to Looker Studio
Step 5.1: Add the Data Source
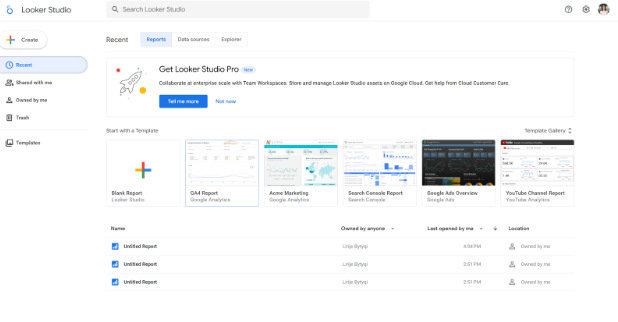
- Go to lookerstudio.google.com and create a Blank Report
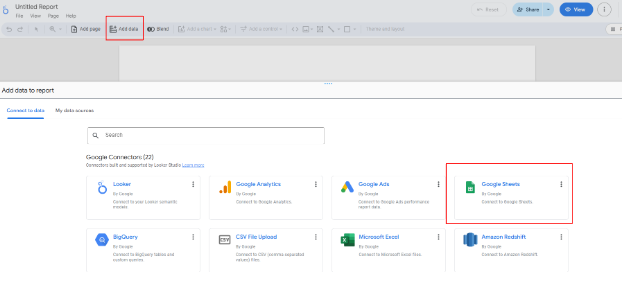
Click Add Data and select Google Sheets.
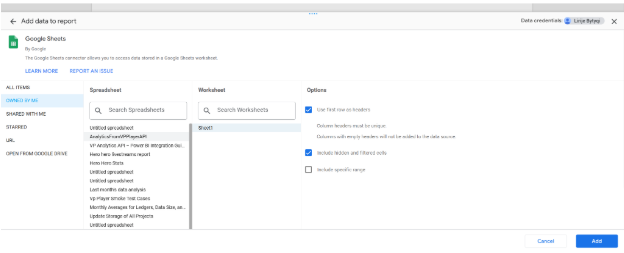
Select your Sheet and click Add
Use available charts and visual elements to build interactive dashboards (tables, time series, device breakdowns, etc.).
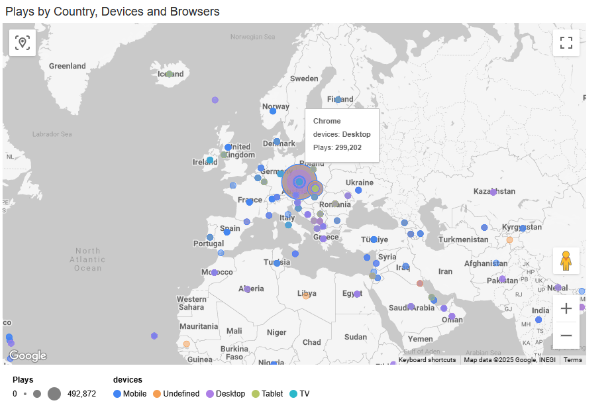
6. Example - Plays by Country, Devices and Browsers
7. Notes & Best Practices
- Authorization: Always include a valid API Key in requests.
- Project ID: Use the correct project associated with your API Key.
- Security: Keep the API key only in Apps Script (do not write it into the Sheet). Rotate if exposed.
-Refresh strategy: Run importToSheet manually or set a time-driven trigger (e.g., daily auto-refresh).
- Compatibility: The same API structure works in Power BI, Excel (Power Query), Tableau, etc.