Power BI Integration Guide VP Analytics API
1. Overview
This guide explains how to connect Power BI to the VP Analytics API in order to visualize player data such as views, devices, browsers, and completion rates. The integration works by directly calling the API with a custom query and transforming the JSON response into a Power BI table.
2. Data Flow Summary
VP Analytics API → Power BI → Reports & Dashboards
- VP Analytics API – Provides analytics data through secure endpoints.
- Power BI – Fetches data via an HTTP query and converts it into visual reports.
3. Power BI Integration (Step-by-Step)
Step 1. Get VP Player API Key
- To access the VP Player API, you must include your API KEY in all API calls. Your API KEY can be found in the VP Player client interface. If you're having trouble locating your API KEY, please consult the User Guide > Security > ApiKeys.
Step 2. Open Power BI
Open Power BI Desktop and create a Blank Report.
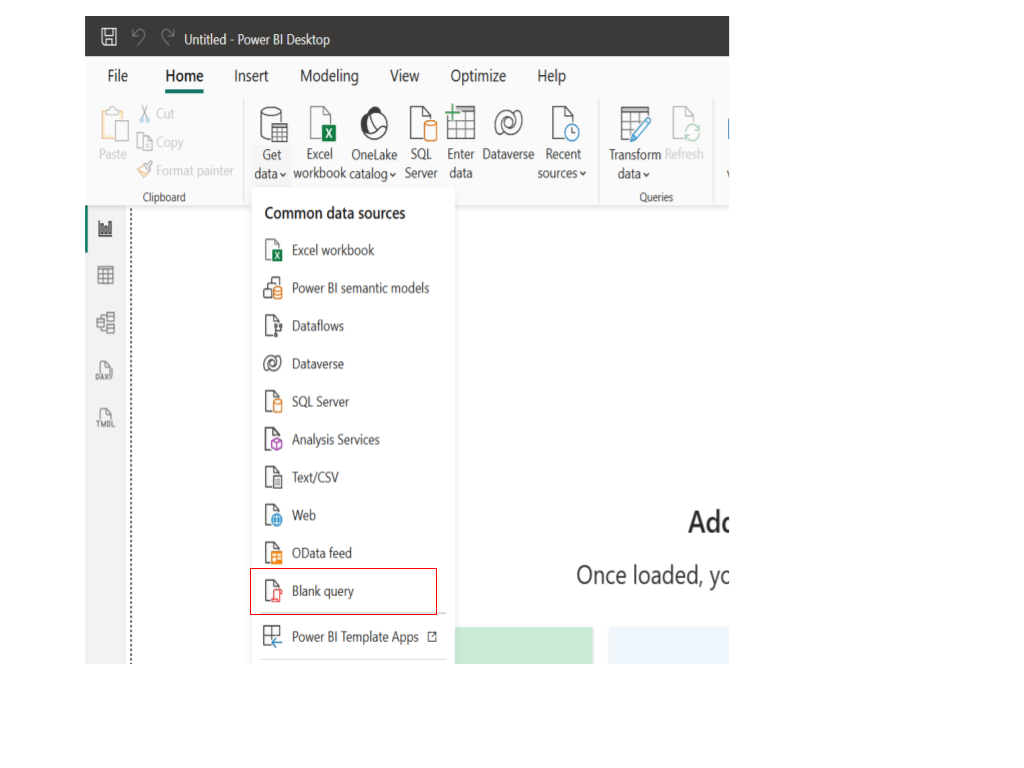
Select Get Data → Blank Query.
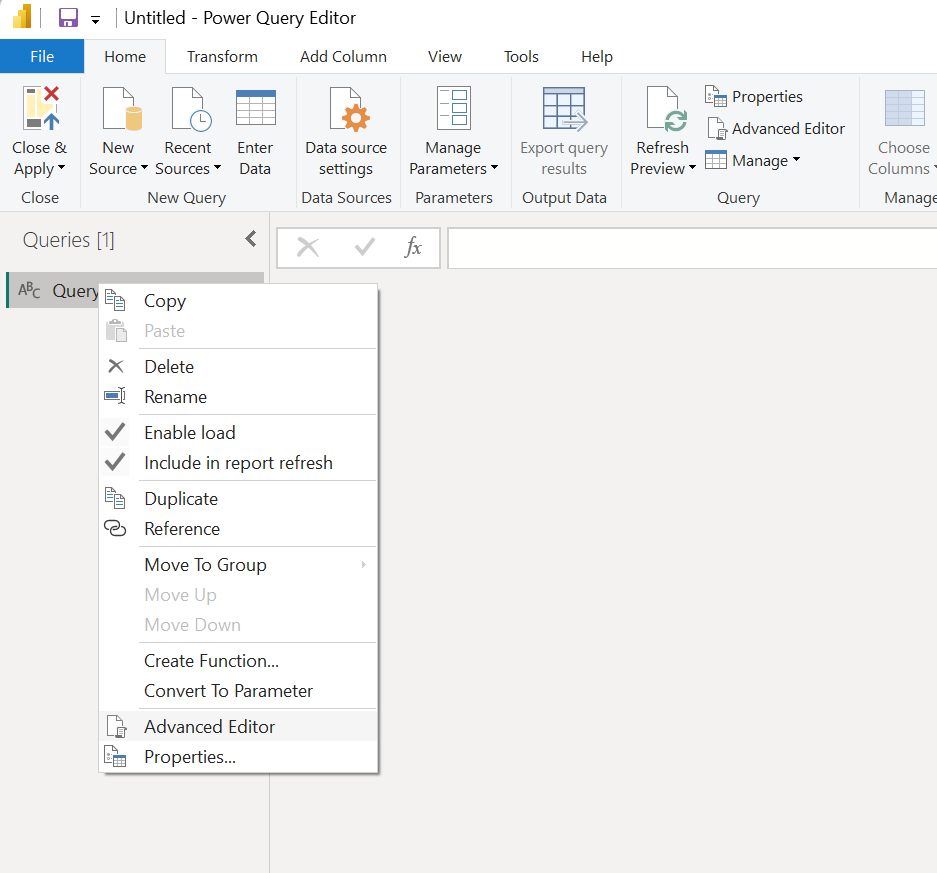
In the Queries pane, right-click the newly created query (default name: Query1) and choose Advanced Editor.
Step 3: Add the Query Script
You can use the JSON query that is automatically generated when you create a New Custom Report in the VP Player Admin Panel. This can be found under Analytics → Custom Reports in the left navigation menu.
If you’re not using a predefined Custom Report, you can manually build your own query by specifying dimensions, metrics, and filters.
To learn how to create a New Custom Report from the Admin panel, visit our documentation: "Create Custom Report"
To fetch available dimensions, metrics, and filters directly through the API, visit our documentation: Custom Report Fields API
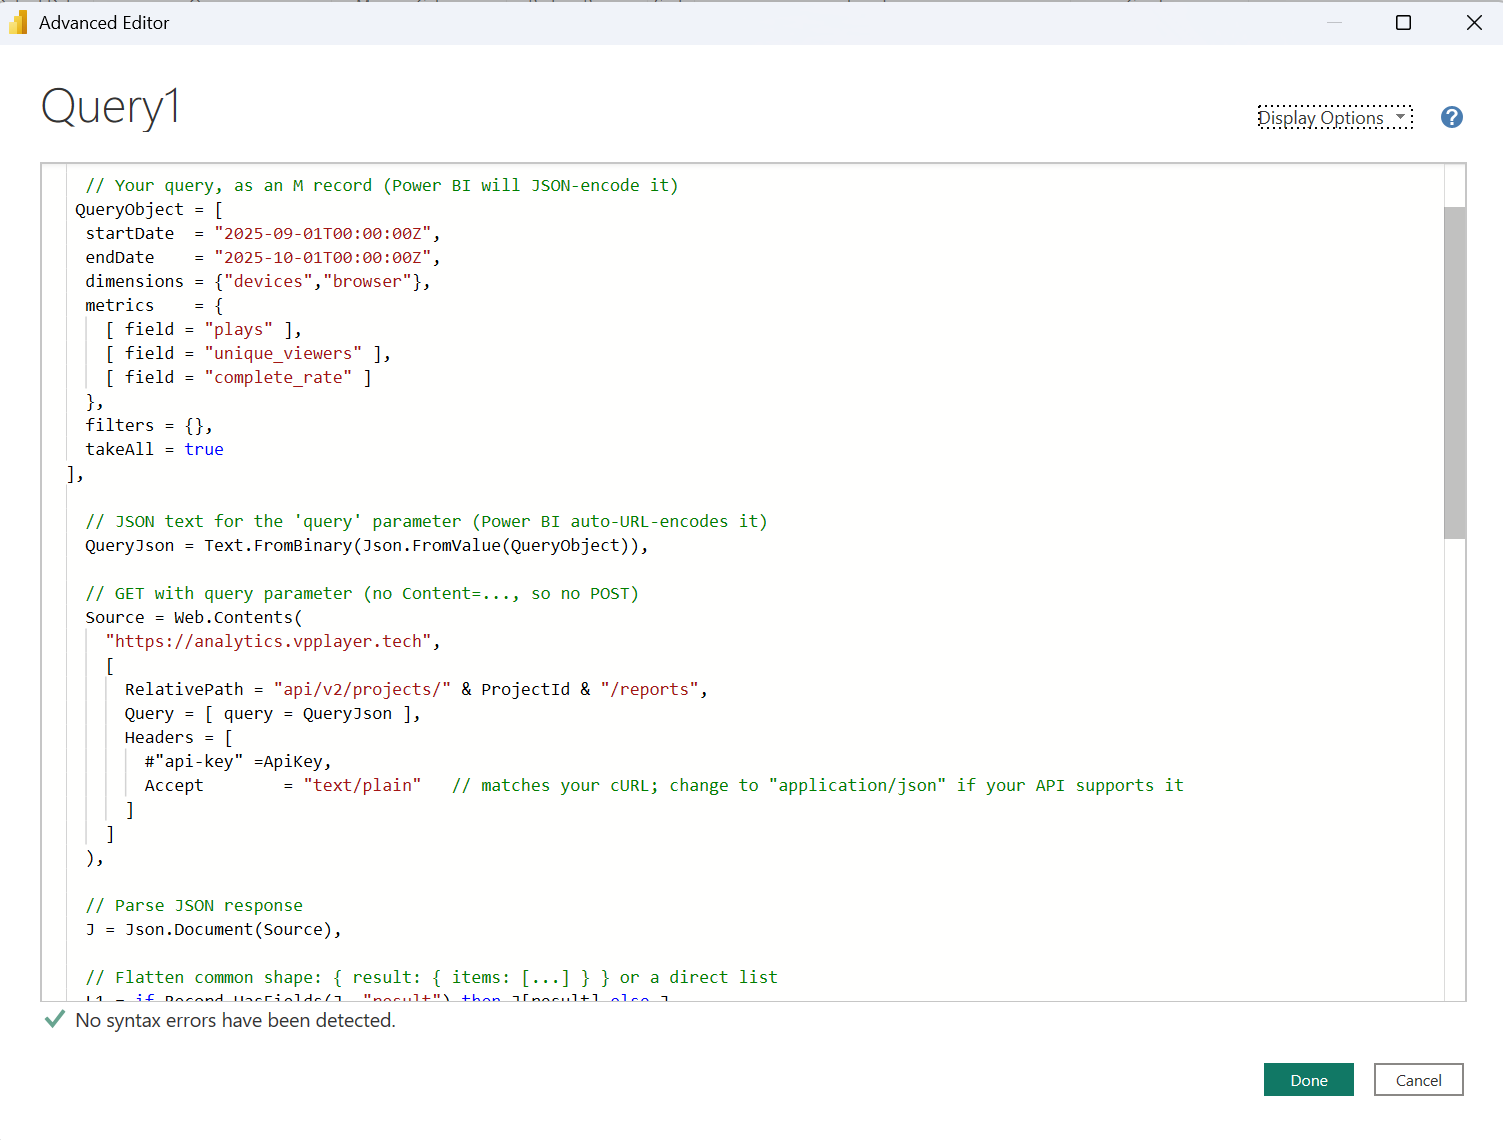
Once you have your query details, paste and configure the following Power Query (M) script:
let
    ***// --- EDIT THESE VALUES ---***
    ProjectId = "YOUR_PROJECT_ID",
    ApiKey    = "YOUR API KEY ",

    // --- Define the query parameters ---
    QueryObject = [
        startDate  = "2025-09-01T00:00:00Z",
        endDate    = "2025-10-01T00:00:00Z",
        dimensions = {"devices", "browser"},
        metrics    = {
            [ field = "plays" ],
            [ field = "unique_viewers" ],
            [ field = "complete_rate" ]
        },
        filters = {},
        takeAll = true
    ],

    // Convert to JSON
    QueryJson = Text.FromBinary(Json.FromValue(QueryObject)),

    // Make the API request
    Source = Web.Contents(
        "https://analytics.vpplayer.tech/",
        [
            RelativePath = "api/v2/projects/" & ProjectId & "/reports",
            Query = [ query = QueryJson ],
            Headers = [
           #"api-key" =ApiKey,
                Accept = "application/json"
            ]
        ]
    ),

    // Parse the JSON response
    JsonResponse = Json.Document(Source),
    ResultBlock  = if Record.HasFields(JsonResponse, "result") then JsonResponse[result] else JsonResponse,
    Items        = if Value.Is(ResultBlock, type record) and Record.HasFields(ResultBlock, "items") then ResultBlock[items] else ResultBlock,

    // Convert to table
    TableRaw = if Value.Is(Items, type list) then Table.FromList(Items, Splitter.SplitByNothing(), {"record"}) else Items,
    Columns  = if Table.RowCount(TableRaw) > 0 and Value.Is(TableRaw{0}[record], type record)
                then Record.FieldNames(TableRaw{0}[record])
                else {},
    FinalTable = if List.Count(Columns) > 0 then Table.ExpandRecordColumn(TableRaw, "record", Columns) else TableRaw
in
    FinalTable
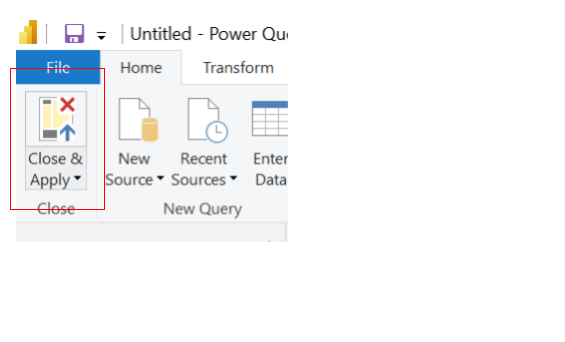
Step 4: Apply and Configure
Click Done to close the editor.
Click Close & Apply in the top-left corner.
If Power BI shows an Access Web Content warning:
Go to File → Options & Settings → Data Source Settings
Select your API URL
Click Edit Permissions → Change to Anonymous
Step 5: Visualize Your Data
Once the query loads successfully:
You’ll see the data table in the Data Pane.
Rename the query if needed.
Use Power BI visualizations (tables, charts, filters) to build your reports.
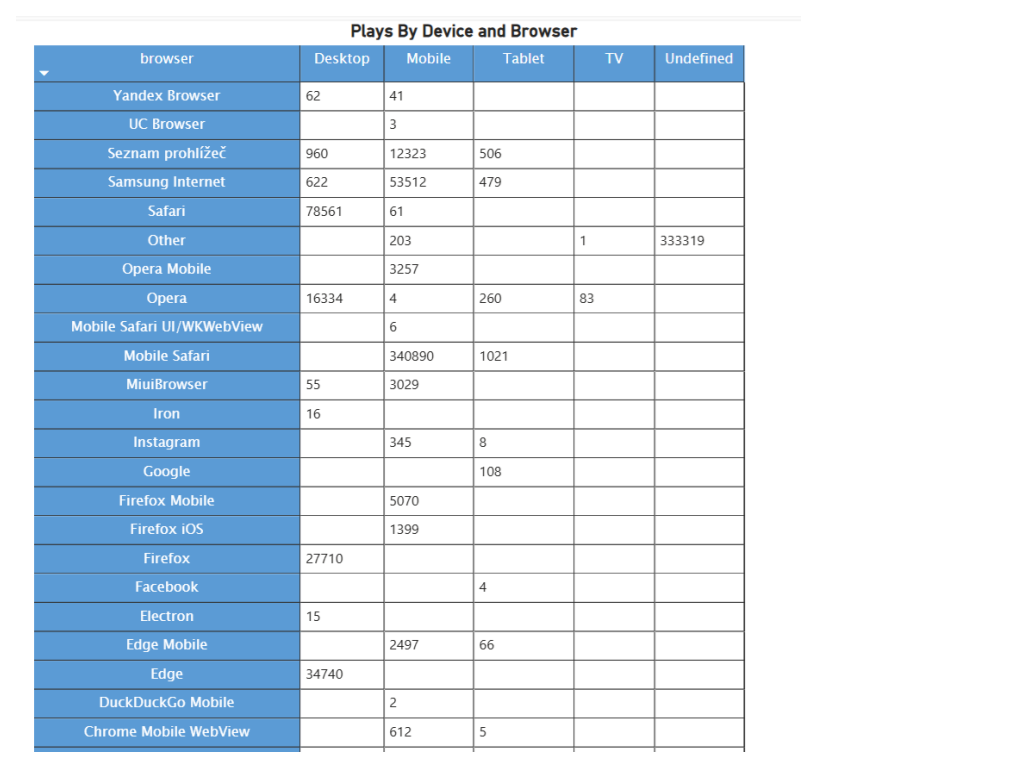
4. Example Output – Plays by Device and Browser
5. Notes and Best Practices
Authorization: Always include your valid API Key.
Project ID: Replace with your specific project identifier.
Date Range: Adjust startDate and endDate to match your reporting needs.
Security best practice: Store the key in a Power BI Parameter (Manage Parameters) instead of hard-coding. If you’ve shared your real key publicly anywhere, rotate it.
Compatibility: The same API can also be used in Tablou, Excel (Power Query), or other BI tools that support REST/JSON data.