Tableau Integration Guide with VP Analytics API
1. Overview
This guide explains how to connect Tableau to the VP Analytics API in order to visualize player analytics such as plays, unique viewers, devices, browsers, and completion rates. The integration works by using a Web Data Connector (WDC) that calls the API with a custom query and transforms the JSON response into a Tableau data source
2. Data Flow Summary
VP Analytics API → Tableau Web Data Connector → Reports & Dashboards
- VP Analytics API – Provides analytics data through secure endpoints based on dimensions, metrics, and filters.
- Tableau – Fetches and visualizes the data using an interactive Web Data Connector (HTML/JavaScript).
3. Tableau Integration (Step-by-Step)
Step 1: Get VP Player API Key
To access the VP Player API, you must include your API KEY in all requests. You can find your API KEY in the VP Player Admin interface under: User Guide > Security > ApiKeys.
- If you cannot locate your key, please consult your Administrator or the User Guide.
Step 2: Create the Web Data Connector (WDC) File
- Open a text editor (e.g., Visual Studio Code).
- Create a new file named tabelau.html.
- Paste the following WDC script:
<!DOCTYPE html>
<html>
<head>
  <meta charset="utf-8" />
  <title>VP Analytics – Tableau WDC (GET + header)</title>
  <script src="https://connectors.tableau.com/libs/tableauwdc-2.3.0.js"></script>
  <style>body{font-family:system-ui,Arial;margin:24px;max-width:760px}</style>
</head>
<body>
  <h2>VP Analytics API → Tableau</h2>

  <label>ProjectId</label><br/>
  <input id="projectId" placeholder="YOUR_PROJECT_ID" style="width:520px" /><br/><br/>

  <label>ApiKey</label><br/>
  <input id="apiKey" placeholder="YOUR API KEY" style="width:520px" /><br/><br/>

<label>QueryObject (JSON)</label><br/>
<textarea id="queryJson" rows="12" style="width:520px">
YOUR QUERY OBJECT
</textarea>
  <br/>
  <button id="btnConnect">Connect</button>

<script>
(function () {
  const API_BASE = "https://analytics.vpplayer.tech";
  const connector = tableau.makeConnector();

  function buildUrl(projectId, queryObj) {
    const q = encodeURIComponent(JSON.stringify(queryObj));
    return `${API_BASE}/api/v2/projects/${projectId}/reports?query=${q}`;
  }

  async function fetchReport(projectId, queryObj, apiKey) {
    const url = buildUrl(projectId, queryObj);
    const res = await fetch(url, {
      method: "GET",
      headers: {
        "api-key": apiKey,
        "Accept": "application/json"
      }
    });
    if (!res.ok) throw new Error(`${res.status} ${res.statusText}`);
    return res.json();
  }

  connector.getSchema = async (cb) => {
    try {
      const cfg = JSON.parse(tableau.connectionData);
      const json = await fetchReport(cfg.projectId, cfg.queryObj, tableau.password);

      const result = (json && json.result) || json || {};
      const meta   = result.rowsMetadata || {};
      const cols   = [];

      (meta.dimensions || []).forEach(d => {
        const id = d.key || d.field || d.display;
        cols.push({ id, alias: d.display || id, dataType: tableau.dataTypeEnum.string });
      });
      (meta.metrics || []).forEach(m => {
        const id = m.key || m.field || m.display;
        cols.push({ id, alias: m.display || id, dataType: tableau.dataTypeEnum.float });
      });

      if (cols.length === 0) {
        const first = (result.rows || result.items || [])[0] || {};
        Object.keys(first).forEach(k => {
          const isNum = typeof first[k] === "number";
          cols.push({ id: k, alias: k, dataType: isNum ? tableau.dataTypeEnum.float : tableau.dataTypeEnum.string });
        });
        if (cols.length === 0) cols.push({ id: "plays", alias: "Plays", dataType: tableau.dataTypeEnum.float });
      }

      cb([{ id: "vp_analytics", alias: "VP Analytics Report", columns: cols }]);
    } catch (e) {
      tableau.abortWithError("Schema error: " + (e.message || e));
    }
  };

  connector.getData = async (table, done) => {
    try {
      const cfg = JSON.parse(tableau.connectionData);
      const json = await fetchReport(cfg.projectId, cfg.queryObj, tableau.password);
      const result = (json && json.result) || json || {};
      const rows   = result.rows || result.items || [];
      table.appendRows(rows.map(r => (r && typeof r === "object") ? r : { value: r }));
      done();
    } catch (e) {
      tableau.abortWithError("Data fetch error: " + (e.message || e));
    }
  };

  tableau.registerConnector(connector);

  document.getElementById("btnConnect").addEventListener("click", () => {
    const projectId = document.getElementById("projectId").value.trim();
    const apiKey    = document.getElementById("apiKey").value.trim();
    let queryObj;
    try { queryObj = JSON.parse(document.getElementById("queryJson").value); }
    catch { alert("Invalid JSON in QueryObject"); return; }
    if (!projectId || !apiKey) { alert("Fill ProjectId and ApiKey"); return; }

    tableau.connectionName = "VP Analytics API (GET)";
    tableau.password       = apiKey; // stored securely by Tableau
    tableau.connectionData = JSON.stringify({ projectId, queryObj });
    tableau.submit();
  });
})();
</script>
</body>
</html>
Step 3: Start a Local Server
- Open a terminal in the folder containing tabelau.html.
- Run this command: python -m http.server 8000
- Confirm it shows: Serving HTTP on port 8000 …
Step 4: Connect from Tableau
- Open Tableau Desktop.
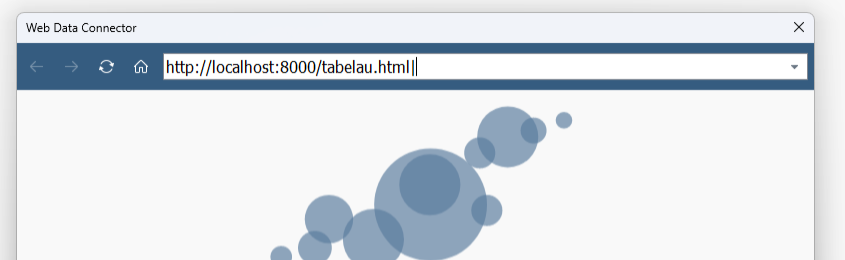
- Go to Connect → To a Server → Web Data Connector.
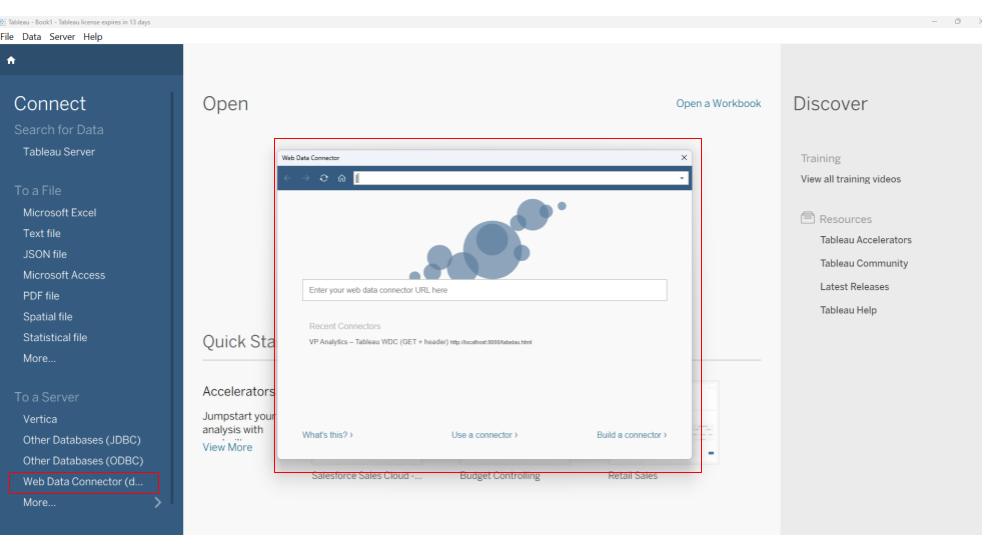
Enter the URL: http://localhost:8000/tabelau.html
Fill the fields:
ProjectId → your VP project ID
ApiKey → your VP Analytics API key
You can use the JSON query that is automatically generated when you create a New Custom Report in the VP Player Admin Panel. This can be found under Analytics → Custom Reports in the left navigation menu.
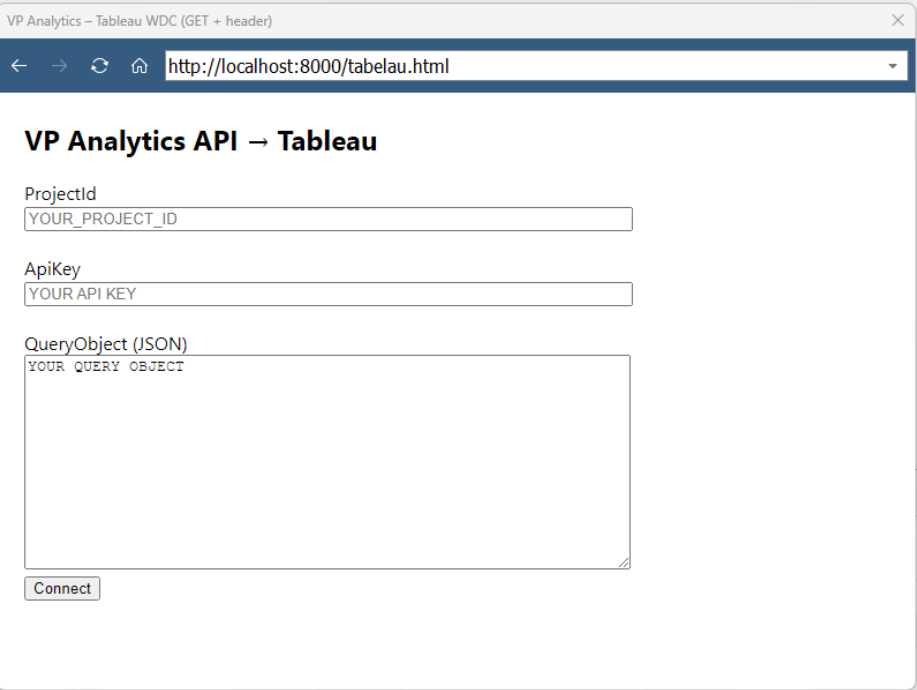
If you’re not using a predefined Custom Report, you can manually build your own query by specifying dimensions, metrics, and filters.
To learn how to create a New Custom Report from the Admin panel, visit our documentation: "Create Custom Report"
To fetch available dimensions, metrics, and filters directly through the API, visit our documentation: Custom Report Fields API
- Click Connect.
If everything is correct, Tableau will display the schema preview.
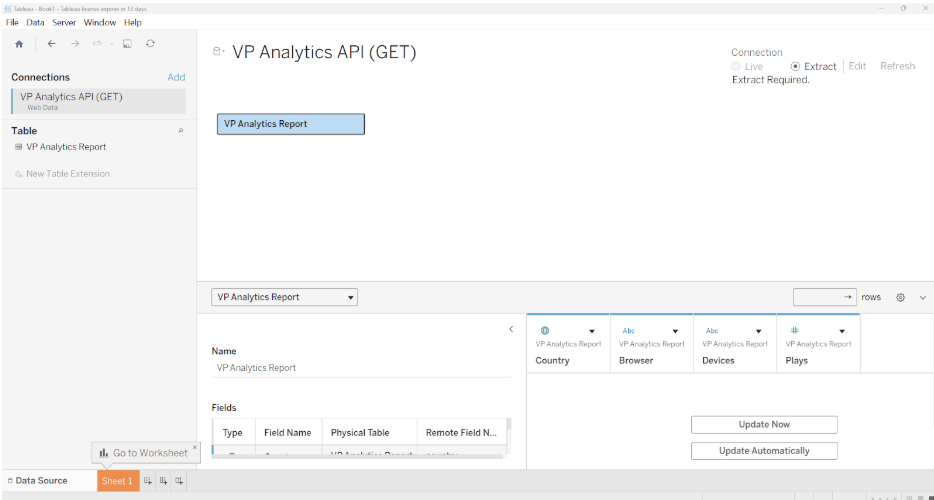
Step 5: Apply and Visualize
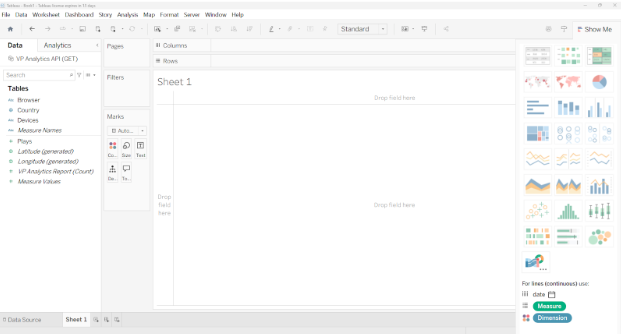
- Go to Sheet 1 to start building your reports.
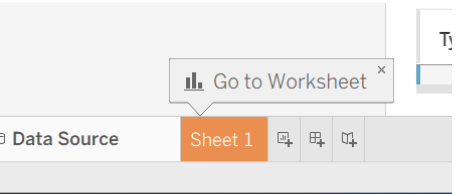
- Go to Sheet 1 to start building your reports.
Once your data is loaded, Tableau will display it in the Data pane. You can now drag and drop the available fields onto the sheet to create your desired visualizations.
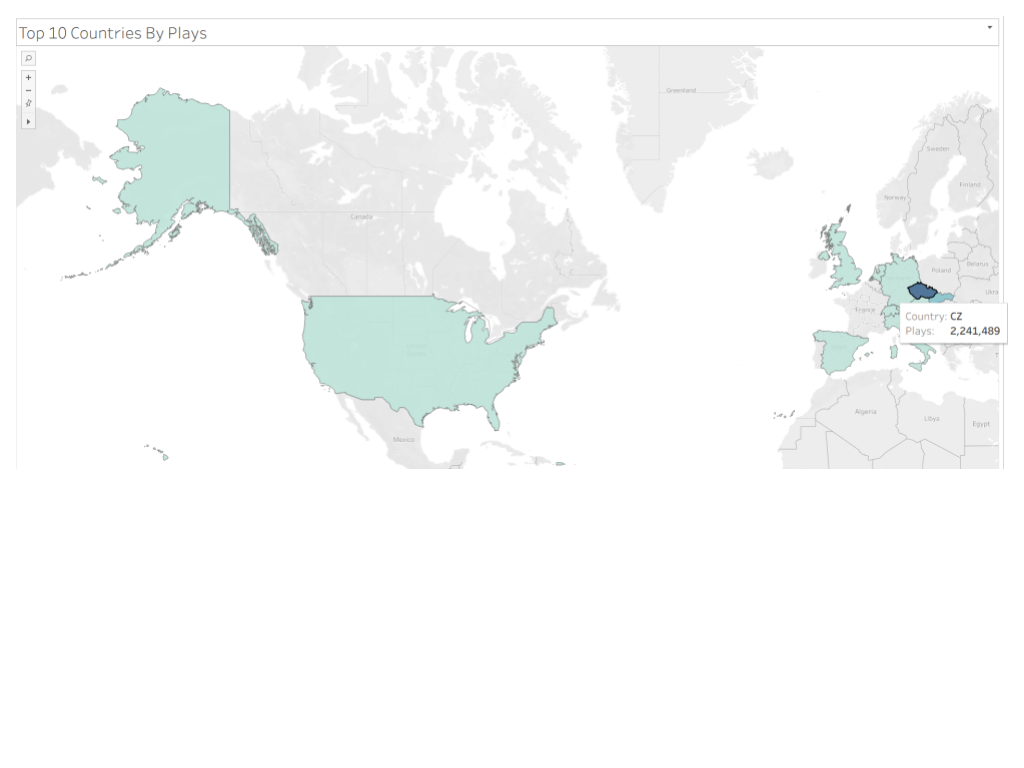
4. Example Output – Top 10 Countries by Plays
5. Notes and Best Practices
- Authorization : Always include your valid API Key in every call.
- Project ID : Replace with your unique VP Project identifier.
- Date Range : Adjust startDate and endDate to fit your analysis period.
- Security : If possible, store the API key as a Tableau Credential Parameter or inside a published data source with managed secrets.
- CORS (for local testing) : Ensure your API allows:
- Access-Control-Allow-Origin: http://localhost:8000
- Access-Control-Allow-Methods: GET, OPTIONS
- Access-Control-Allow-Headers: api-key, Accept, Content-Type
- Compatibility: The same API works with Power BI, Looker Studio, and Excel (Power Query).
- The only difference is the connection script syntax.